NEED TO BE 100 PERCENT HUMAN WRITTEN, ADD AI AND PLAGIARISM REPORT
What You Will Learn: In this touchstone, you will interpret basic environmental science data to communicate observed trends, causes, future impacts, and possible solutions to an audience of non-scientists. You will analyze the local trends in a chosen environmental parameter (greenhouse gas emissions, water pollution, or air pollution) over the last 15 years and use the lens of knowledge you gained from this course to build a slide deck for a presentation that will: 1) explain the trends to a non-specialist audience, 2) describe how the local community contributes to these trends; 3) explain possible long-term impacts and challenges, and 4) describe two approaches that can be implemented at each level (government, business, and individual) to help achieve sustainability. Why It Matters: Effective communication of environmental science issues requires making scientific material understandable by and relatable to audiences that may have different amounts of knowledge on the topic. This project will help you refine your communication of an important topic in environmental science for a non-specialist target audience. What You Will Hand In:
- A 10-slide presentation in Microsoft PowerPoint format (.pptx).
- Use of 2–3 sources integrated into your presentation speaker notes.
- APA-formatted citations and references
Keys to Success:
- Develop and submit original work
- Meet the length requirement (10 slides with 2–3 references)
- Follow all conventions for academic writing
- Use correct APA formatting of citations and references
download
Touchstone 4 Presentation Template
Helpful Links:
- Citation Help
- Academic Integrity Guidelines
- Ethical Standards and Appropriate Use of AI
Example:
- Touchstone 4 Presentation Example
Share your feedback on Touchstones
Instructions
Step 1: Review the Scenario and Background Information
SCENARIO: For this assignment, you will take on the fictional role of an environmental consultant for your local community sustainability task force. The task force is committed to making sustainability a central focus of local planning and decision-making. You have been asked to create a presentation on an environmental issue of concern—greenhouse gas emissions, water quality, or air quality. In your presentation, you will explain recent local trends related to your chosen issue, describe how this affects your local community, and recommend actions that local government, businesses, and individuals can take to help reduce their impact and promote a more sustainable future. You will develop the slide deck for a presentation intended for a local community group that includes government officials, business owners, and other citizens. BACKGROUND INFORMATION: Greenfield is a fictional mid-sized town of 45,000 people located in a temperate forest biome, and the population has been growing over the past several decades. The local economy depends on agriculture, small manufacturing plants, and a growing industrial sector. Greenfield faces environmental pressures linked to national and global trends, including climate change and pollution from transportation, agriculture, and industry. Over the past couple of decades, residents and local leaders have become increasingly aware of environmental challenges facing their community, including poor air quality on many days, increased frequency and severity of harmful algal blooms and more pollution in local water bodies, increased deforestation from agricultural expansion and logging, and high costs associated with increased energy use during periods of extreme temperature and weather events.
In response, the Greenfield Sustainability Task Force was established by the town council to guide the transition toward a more sustainable future. Its mission is to build a thriving community that balances economic growth, environmental stewardship, and social well-being. To achieve these goals, the task force would like members of the Greenfield community to be engaged and understand local environmental trends.
Over the last 15 years, the following annual average emissions, water quality, air quality, and forest area data for Greenfield were recorded. A few years into measurements, the Greenfield Sustainability Task Force became alarmed by the trends they were observing. In response to growing environmental concerns, members of the community launched several sustainability initiatives to reduce pollution and protect local natural resources. In the 7th year, Greenfield invested in a local community bike program and built new pedestrian paths to reduce vehicle use, implemented tree protection and replanting rules, and planted several native plant buffers around manufacturing plants and farms to help lessen runoff into Greenfield River.
Environmental Indicators in Greenfield Over 15 Years Data Table Note: The Forest Area column is highlighted in grey because it is used in the example project and should not be referenced for your project.
| Year | Greenhouse Gas Emissions (t CO₂e per capita) | Phosphorus in Greenfield River (mg/L) | Fine Particulate Matter PM2.5 (µg/m³) | Forest Area (ha) |
|---|---|---|---|---|
| 1 | 10.3 | 0.12 | 3.2 | 4,150 |
| 2 | 14.4 | 0.19 | 4.6 | 4,020 |
| 3 | 16.1 | 0.24 | 5.9 | 3,810 |
| 4 | 16.7 | 0.43 | 7.6 | 3,793 |
| 5 | 18.4 | 0.45 | 7.9 | 3,330 |
| 6 | 18.9 | 0.49 | 8.1 | 3,278 |
| 7 | 22.0 | 0.62 | 9.8 | 2,950 |
| 8 | 22.3 | 0.65 | 10.1 | 2,900 |
| 9 | 22.7 | 0.68 | 10.3 | 2,855 |
| 10 | 22.8 | 0.71 | 10.6 | 2,815 |
| 11 | 23.0 | 0.74 | 10.9 | 2,780 |
| 12 | 23.4 | 0.76 | 11.2 | 2,745 |
| 13 | 23.9 | 0.79 | 11.4 | 2,715 |
| 14 | 24.0 | 0.81 | 11.6 | 2,685 |
| 15 | 24.4 | 0.84 | 11.8 | 2,655 |
Recently, a presentation was given at a public sustainability forum on the deforestation patterns in Greenfield (see the Example below). The task force found this to be exceptionally useful for helping members of the community understand local deforestation trends and how to further address concerns surrounding deforestation.
Now, the task force has invited you, an environmental scientist and consultant, to review the collected data and present on another environmental parameter (greenhouse gas emissions, phosphorus levels in the Greenfield River, or the atmospheric concentration of fine particulate matter) at another public sustainability forum that brings together local government officials, business owners, and citizens. Your presentation will help members of the community understand environmental trends in Greenfield, how the town’s practices contribute to these patterns, possible future effects, and what actions each sector (government, business, and individuals) can take to build a more sustainable future.
Step 2: Choose a Dataset
Below are descriptions of the datasets for each environmental parameter.
- Select one of the following datasets to develop your presentation.
- If needed, you can reference the raw values for each parameter from the table above.
- Only water, air, or greenhouse gas emissions can be chosen. Note that deforestation is not an option since it is used in the example.
Click each dataset title to view additional details:
Dataset 1: Greenhouse Gas Emissions
Dataset 2: Water Quality
Dataset 3: Air Quality
Step 3: Create Presentation Slides
Use a presentation tool like PowerPoint or Google Slides to outline and organize your presentation. Feel free to add titles, graphics, or transitions to the slides and slide deck, but note that these are not required or part of your grade.
Your presentation must be 10 slides long, including the title slide and reference slide. You must cite 2–3 sources, which can include course lessons and at least one scientific peer-reviewed research article, in your presentation. Your presentation must include the following slides:
- Title: Your title slide will be the first slide and should include your name, the date, and the environmental parameter you selected.
- Introduction: Introduce the chosen issue by stating 1) what it is, 2) why it matters globally, and 3) its relevance to the local community. Describe each in the notes section.
- Local contributions: Identify two ways the Greenfield community adds to this environmental issue based on the described characteristics of this community. Explain how each factor contributes in the notes section.
- Data interpretation: Show the provided line graph that tracks global changes in your selected issue. Identify 1) what pattern the graph shows, 2) any changes in pattern, and 3) the key drivers that are causing the observed pattern. Use simple language so your audience of non-scientists can easily understand. Describe the pattern shown, any year when a change in trend occurred, and key drivers in the notes section.
- Projected future impacts: Identify two possible effects on the Greenfield community in the future if current trends continue. Describe these impacts in the notes section.
- Government actions: Identify two actions the local government could take to help reduce the community’s impact on the issue. Explain each action in the notes section.
- Business actions: Identify two actions local businesses could take to help reduce their impact on the issue. Explain each action in the notes section.
- Individual actions: Identify two actions local citizens could take to help reduce their impact on the issue. Explain each action in the notes section.
- Conclusions: Summarize two ways that the collective actions of the local community could affect the future of Greenfield.
- References: List the 2–3 references cited in your presentation on your last slide in APA format in alphabetical order by the first author’s last name (or organization name). You may reference course lessons or peer-reviewed scientific sources, but at least one of your sources must be a peer-reviewed research article.
If you’ve never used a presentation tool like PowerPoint or Google Slides before, don’t worry! The assignment template below will help you create slides for a basic slide presentation. Then, you’ll be able to practice using presentation technology as you put the finishing touches on your presentation. You should change the titles of the slides in the template to appropriately match your presentation topic (e.g., in the Example, the Introduction slide is titled “Deforestation”, and this slide includes an introduction to the topic of deforestation). You can also download an example of a completed presentation below.
Step 4: Add Speaker Notes
For this assignment, you are not giving the presentation but preparing a slide deck summarizing your findings and recommendations.
An important step in preparing a presentation is writing speaker notes. Speaker notes are notes added to a slide presentation as a reference for the presenter and can be found below each slide. For this touchstone, add your speaker notes to explain your analysis using information from your sources. If you were giving an oral presentation, these notes wouldn’t be visible to your audience when you’re in Presenter View. But you would be able to see them, and they would guide you through your presentation.
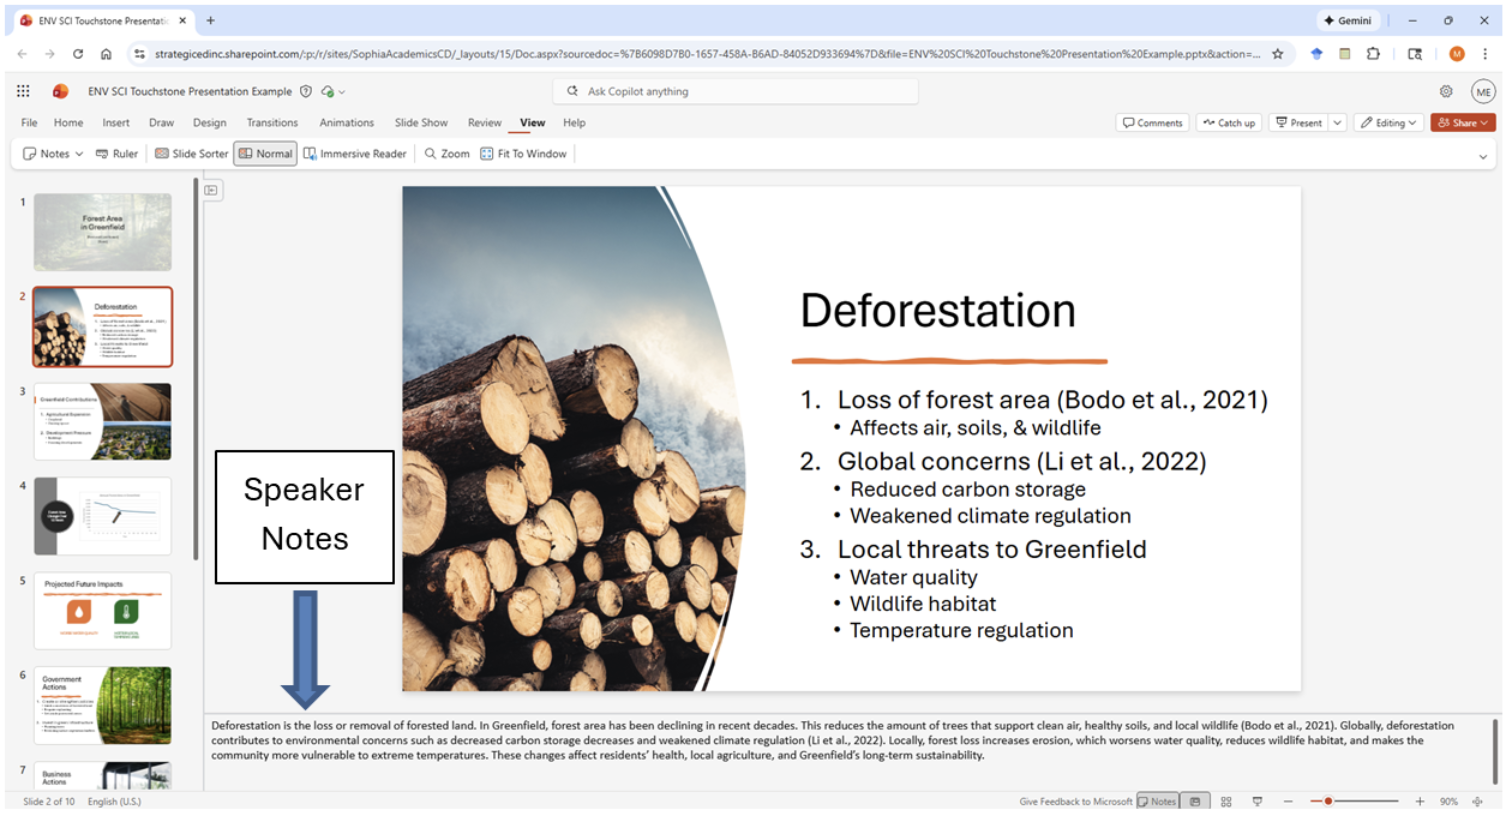
Your speaker notes will be used to evaluate your project, so make sure you write in complete sentences and pay attention to spelling and grammar.
You must use two to three outside sources to research and explain your chosen issue. At least one of these sources must be a scientific, peer-reviewed, research article. Additionally:
- Use credible sources (e.g., textbooks, academic journals, or websites that end in .org, .gov, or .edu).
- Avoid non-credible sources such as social media or Wikipedia.
- When referencing sources in your presentation include an in-text citation using APA format. These citations should include the author’s last name and the year of publication for the source, like this: (Mitchell, 2014). See the APA Style: Citation Help resource for guidance.
Step 5: Review and Submit Your Work
Once you have completed your slides and corresponding speaker notes, it is time to submit your presentation. If you are using PowerPoint, you simply need to save your presentation and upload this file to Sophia. If you are using another slide presentation technology, download the slide deck as a Microsoft PowerPoint (.pptx) and upload that version to Sophia.