Use the given graph of f to state the value of each quantity, if it exists. (If an answer does not exist, enter DNE.)
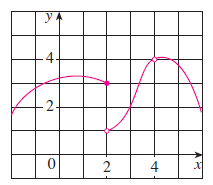
(a)lim x → 2− f(x)
(b)
lim x → 2+ f(x)
(c)
lim x → 2 f(x)
(d)
f(2)
(e)
lim x → 4 f(x)
(f)
f(4)
For the function h whose graph is given, state the value of each quantity, if it exists. (If an answer does not exist, enter DNE.)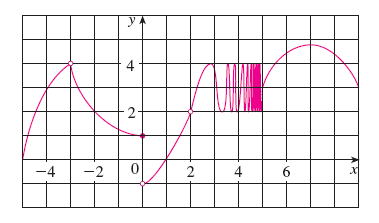
(a)lim x → −3− h(x)
(b)
lim x → −3+ h(x)
(c)
lim x → −3 h(x)
(d)
h(−3)
(e)
lim x → 0− h(x)
(f)
lim x → 0+ h(x)
(g)
lim x → 0 h(x)
(h)
h(0)
(i)
lim x → 2 h(x)
(j)
h(2)
(k)
lim x → 5+ h(x)
(l)
lim x → 5− h(x)
3.
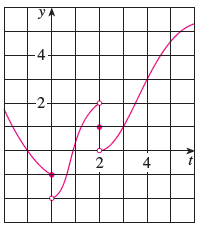
(a)lim t → 0− g(t)
(b)
lim t → 0+ g(t)
(c)
lim t → 0 g(t)
(d)
lim t → 2− g(t)
(e)
lim t → 2+ g(t)
(f)
lim t → 2 g(t)
(g)
g(2)
(h)
lim t → 4 g(t)
4.
Sketch the graph of the function.f(x) = |
| 3 + x | if x < −1 | |
| x2 | if −1 ≤ x < 1 | |
| 2 − x | if x ≥ 1 |
| [Image unavailable: WebAssign Plot] | [Image unavailable: WebAssign Plot] |
| [Image unavailable: WebAssign Plot] | [Image unavailable: WebAssign Plot] |
Use the graph to determine the values of a for which
lim x → a f(x)
does not exist. (Enter your answers as a comma-separated list.)a =
5.
Sketch the graph of an example of a function f that satisfies all of the given conditions.lim x → 0− f(x) = 1,lim x → 0+ f(x) = 2,f(0) = −1| [Image unavailable: WebAssign Plot] | [Image unavailable: WebAssign Plot] |
| [Image unavailable: WebAssign Plot] | [Image unavailable: WebAssign Plot] |
6.
This question has several parts that must be completed sequentially. If you skip a part of the question, you will not receive any points for the skipped part, and you will not be able to come back to the skipped part. Tutorial Exercise
Use a table of values to estimate the value of the limit. If you have a graphing device, use it to confirm your result graphically.lim x→0
| tan(4x) |
| tan(5x) |
7.
[–/9 Points]DETAILSSCALCET8 2.2.009.MY NOTES
For the function f whose graph is shown, state the following. (If an answer does not exist, enter DNE.)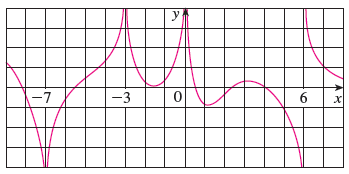
(a)lim x → −7 f(x)
(b)
lim x → −3 f(x)
(c)
lim x → 0 f(x)
(d)
lim x → 6− f(x)
(e)
lim x → 6+ f(x)
(f) The equations of the vertical asymptotes.
| x | = | (smallest value) |
| x | = | |
| x | = | |
| x | = | (largest value) |