Overview
Required materials will be provided upon accepting question.
This week you will need to open a blank excel to build this week's modeling (there is no raw data file to download).
1. Assign a tab to each compound or molecule (you should have three) and along the top of the excel organize the following information:
1. Compound or molecule name
2. Gas constant, R
3. Critical Temperature
4. Critical Pressure
5. The temperature of the gas for your calculations (300 K)
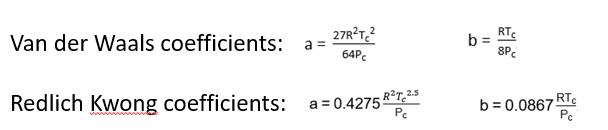
6. Van der Waals equations and formulas for calculating coefficients
7. RK equations and formulas for calculating coefficients
2. Create a molar volume column with proper labels and units containing the following L/mol values: 1163, 945, 246.12, 123.16, 24.615, 6.17, 3.53, 2.48, 1.63
3. Create and calculate pressure columns corresponding to Ideal, Van der Waals, and Redlich Kwong pressures. These columns should call on/use the molar volumes from step 2 to calculate the pressure values.
Keep in mind here that the van der Waals and Redlich Kwong are models of equations of state. As such, they have limitations so if they are predicting conditions that are not possible (such as negative pressures) you can comment on that. Physically, what happens to a gas at some point as pressure continues to increase? A negative pressure prediction is probably a sign that the gas would not be stable at these conditions, and therefore, the molecule or compound would not exist as a gas at that pressure. It is not appropriate to calculate a Z (Step 4.) for conditions that include a negative pressure prediction.
4. Create and calculate compressibility factor columns, Z, for each of the calculated pressure columns.
5. Plot Z vs. V/n, including all three Z columns in one plot. This is essentially the same information as the Z vs. P plot I mention in the video and I would rather you just did this one rather than both. Just keep in mind that as the molar volume decreases, the pressure is increasing, so you can think about how the "idealness" of the gas is changing with both molar volume and pressure. Z is the y axis and V/n is the x axis.
6. Plot n/V vs. P, including all three pressure columns in one plot. n/V is the y axis and P is the x axis.
7. Plot Z vs. n/V, including all three Z columns in one plot. Z is the y axis and n/V is the x axis.
8. Repeat 1 thru 7 for each of your other gaseous compounds or molecules (each on a separate tab).
Remember to organize/color code however you like, format all graphs correctly and include units everywhere. :)
MUST BE ON EXCEL, NOT ANY OTHER GRAPHING/PLOTTING PROGRAM