Instructions
Assignment Guide
Download the attached assignment file.
Part 1
In Part 1 of this assignment, you will begin by producing a line graph that depicts the change in temperature by altitude above Earth’s surface. In the table to the right, you will find temperatures for various altitudes above Earth’s surface. Plot the temperatures on the graph page located on the Assignment 2 Word Document. Once you have plotted your points, connect them with a line. Then, mark the following labels on your chart: Troposphere, Mesopause, Thermosphere, Stratopause, Stratosphere, Tropopause, Ozone Layer, Mesopause Finally, answer the Part 1 questions based on your analysis of the data and the assigned course readings. |
|

Part 2
In Part 2 of this assignment, you will access two video clips shown below. One will be about hurricane formation, and the other will be about the deadliest hurricanes in U.S. history. After going through the videos, answer the associated questions on your Unit 2 Assignment Word Document.
ClickView. (2017, Sep 22). Formation of A Tropical Cyclone [Video]. 3:42 mins. YouTube.
HISTORY. (2019, Jun 7). Deadliest Hurricanes in U.S. History | History [Video]. 6:37 mins. YouTube.
Part 3
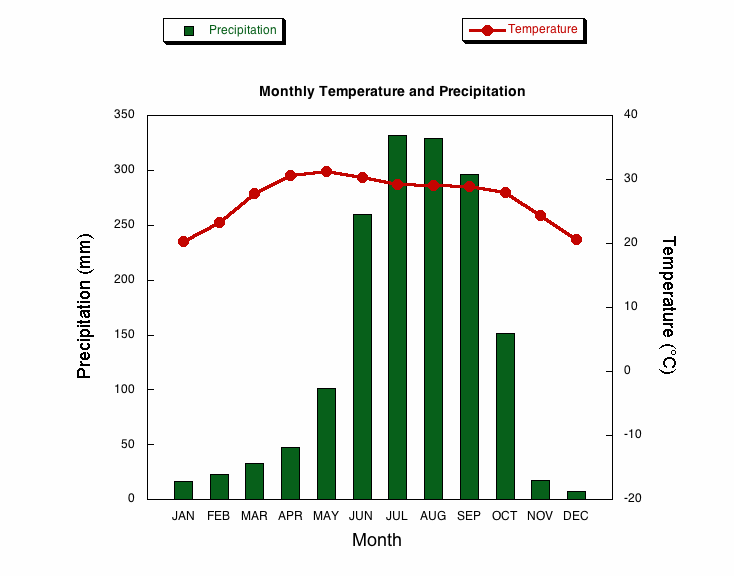
| In Part 3 of this assignment, you will begin by producing a series of climographs. Then, you will extrapolate information from the data that is displayed. A climograph is a graph that shows the annual cycle of temperature and precipitation averages for a geographic region. The x-axis of your graphs will display the months of the year. There will be two opposing y-axis values, for precipitation (in inches) and temperature (in °F). The image to the left is an example of a climograph in Kolkata, India. NASA. (206). Calcutta Metric [PNG]. Wikipedia Commons. |

Remember that climate data is based on the average values of a geographic region over long periods of time. A “climate normal” is the average over a period of at least 30 years within a region. You will be using climate data over a 30-year period in three locations to produce your climographs.
The technological tool you will be using today is Google Sheets. In order to use Google Sheets, it may be necessary to create a Google Account. This can be done with either a personal account or with your Broward College school account.
David Petro. (2014, Dec 9). Create a Climograph with Google Sheets (HD) [Video]. 2:52 mins. YouTube.
Given are three compiled datasets. These datasets show climate "normals" within specific regions. A climate normal is a three-decade average of climatological variables, including temperature and precipitation. It is displayed on a monthly basis. So, where it says Month 01, the Mean column shows the average temperature for all Januarys over a 30 year period. Our data will consist of climate normals from 1981-2010.
Using the available sets of data, produce three climographs with Google Sheets. Use the Mean column only from each dataset. Follow the video tutorial for creating a climograph on Google Sheets. Then, take screenshots of each of your climographs and insert them into your Microsoft Word document. Finally, complete the associated analysis questions on your Microsoft Word document.
Fort Lauderdale, Florida Monthly Normals 1981-2010
Ft. Lauderdale, Florida Temperature Normals 1981-2010 (degrees Fahrenheit) |
Ft. Lauderdale, Florida Precipitation Normals 1981-2010 (inches) |


New York City, New York Monthly Normals, 1981-2010
New York City, New York Temperature Normals 1981-2010 (degrees Fahrenheit) |
New York City, New York Precipitation Normals 1981-2010 (inches) |


San Juan, Puerto Rico Monthly Normals 1981-2010
San Juan, Puerto Rico Temperature Normals 1981-2010 (degrees Fahrenheit) |
San Juan, Puerto Rico Temperature Normals 1981-2010 (inches) |


Submission Instructions
Once completed, submit the Unit 2 Assignment document to this assignment dropbox in either Word or PDF format.
EVR1001_Unit2Assignment.docx(19.93 KB)