Hi - I need quick help to do 8 different cross tabulations based on survey & write appendix C with Significant cross tabs with p-values and significance or lack thereof clearly indicated. ( each answers should be upto 4 decimal places) I need chi sq test, p value to find significance.
Use the Survey Sheet from Qualitrics to collect data and Atatched is also executive summary for reference.
What needs to be done for each cross-tab:
- Observed frequency table (counts, NOT percentages)
- Expected frequency table
- Chi-square value (χ²)
- Degrees of freedom (df)
- p-value (4 decimal places)
- Short interpretation (significant vs. not significant + insight)
🔹 Cross-tabs to complete:
- Q5 × Q6 → Planning Horizon vs Spending Behavior
- Q4 × Q6 → Review Frequency vs Spending Behavior
- Q9 × Q15 → Trust (Bank Linking) vs Biggest Concern
- Q12 × Q9 → Familiarity vs Trust
- Q17 × Q13 → Age vs Feature Preference
🔹 Tools:
Please use Excel:
- Pivot table → observed counts
- Expected values → (Row Total × Column Total) / Grand Total
-
p-value →
=CHISQ.TEST(observed, expected)
🔹 Format:
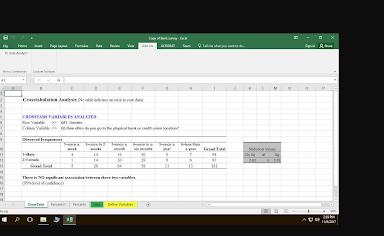
Match the structure used in Cross Tab 1:
- Table labeled “Observed Frequencies”
- Box with Chi Sq, df, Sig
- Final 2–3 line interpretation