Question 1 and Question 2 use different variables. For each question, you can find a description of the indicated variable on this Gender-Career IAT variable descriptions page.
QUESTION 1
The variable for this question is Assoc-Gen-Fam.
- Please state the IAT data set you are working with.
- Use StatCrunch to find the 95% confidence interval that estimates the population proportion of Gender-Career IAT participants who indicate that they associate neither males nor females with family (directions). Highlight and copy everything in your StatCrunch output window and paste it into your response.
- Identify the sample proportion (�^) in your StatCrunch output table. Then determine whether conditions are met for using the confidence interval to estimate the population proportion of participants in your chosen IAT. (Be sure to support your answer as demonstrated in Units 6 and 7.)
- If conditions are met, estimate the population proportion of participants in your particular IAT, and state your conclusion in context. If conditions are not met, explain what a researcher could do so that conditions are met.
- Based on your analysis, do you think the population of participants in your chosen IAT is representative of the U.S. population? Explain.
QUESTION 2
The variable for this question is Race.
Question to be investigated: According to the United States Census Bureau, in 2019 approximately 13.4% of the U.S. population identified themselves as black. Is the proportion of black participants lower for your chosen IAT?
Respond to each of the following.
- State your hypotheses in symbolic form and in words. (The population of interest and the meaning of the proportion � in terms of the variable Race should be clear in your answer.)
- StatCrunch uses a normal model to estimate the �-value probability. Are the normality conditions met? Show your work.
- Use StatCrunch to conduct the hypothesis test (directions). Copy and paste the results (the StatCrunch output window) into the textbox.
- Give your �-value and interpret its meaning as a conditional probability.
- State a conclusion that answers the research question. Use a significance level of 5%. (Your answer should include the �-value and reference the population and the appropriate variable.)
QUESTION 3
We cannot know whether a Type 1 or Type 2 error actually occurs in a hypothesis test. But, based on the results of our hypothesis test, we should be aware of which type of error is possible and what that error means in the context of our test.
- For the hypothesis test, you conducted in Question 2, which type of error is possible, Type 1 or Type 2? Briefly explain why.
- In the context of your hypothesis test, interpret the type of error you identified in part a).Question 1-Directions: One Proportion Confidence Interval with DataThese directions assume your data set is open in StatCrunch.Keep in mind that your data set may be different from the data set in this example. In this example, we calculate the 90% confidence interval to estimate the proportion of females who participated in the 2020 Disability-IAT. Our sample size is n = 300. Your variable or confidence level may be different.
Step 1
Click on the Stat drop-down menu and select Proportion Stats ⟶ One Sample ⟶ With Data.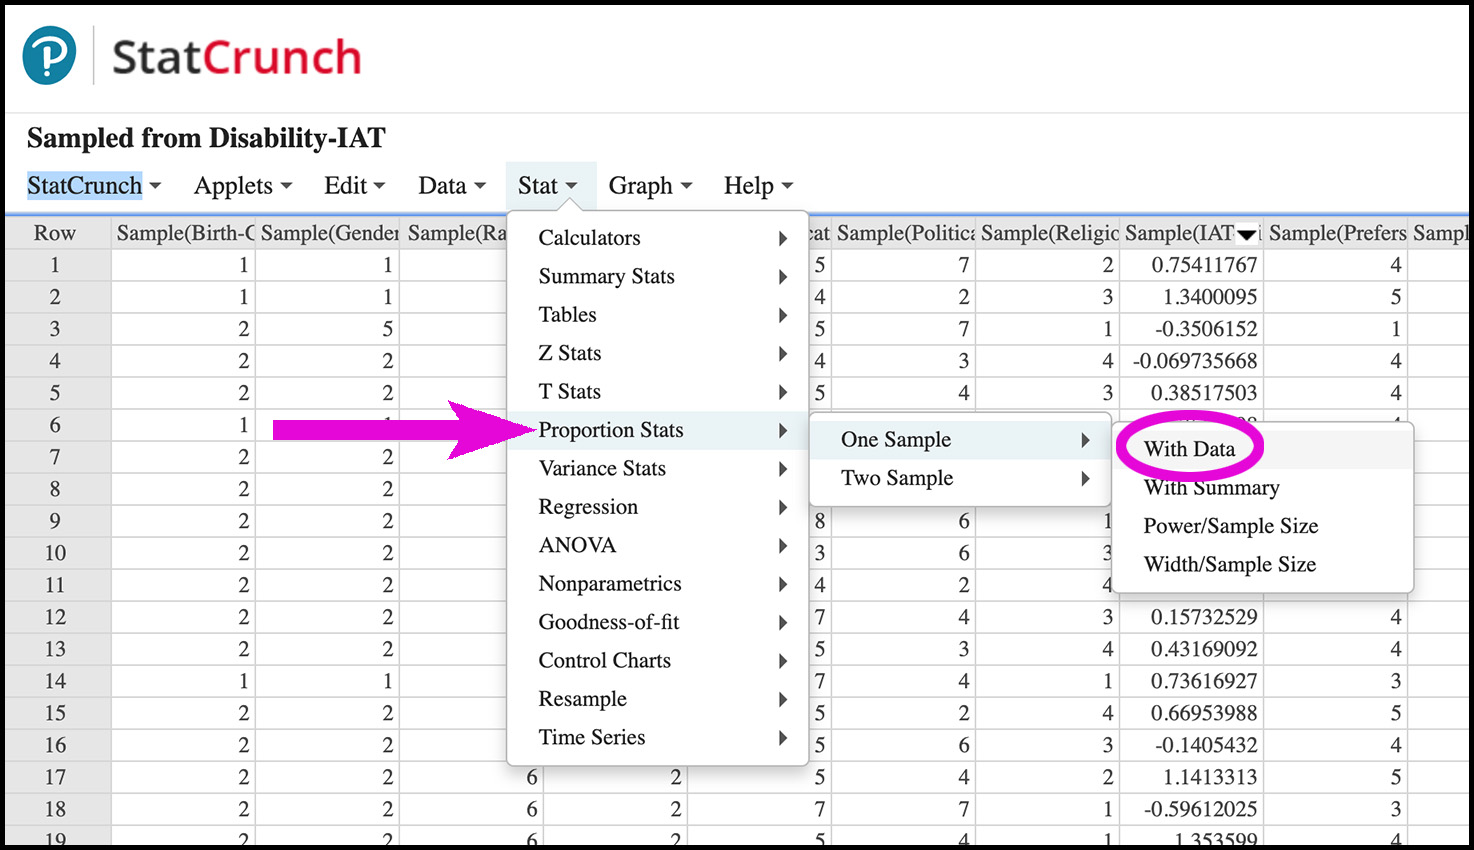
Step 2
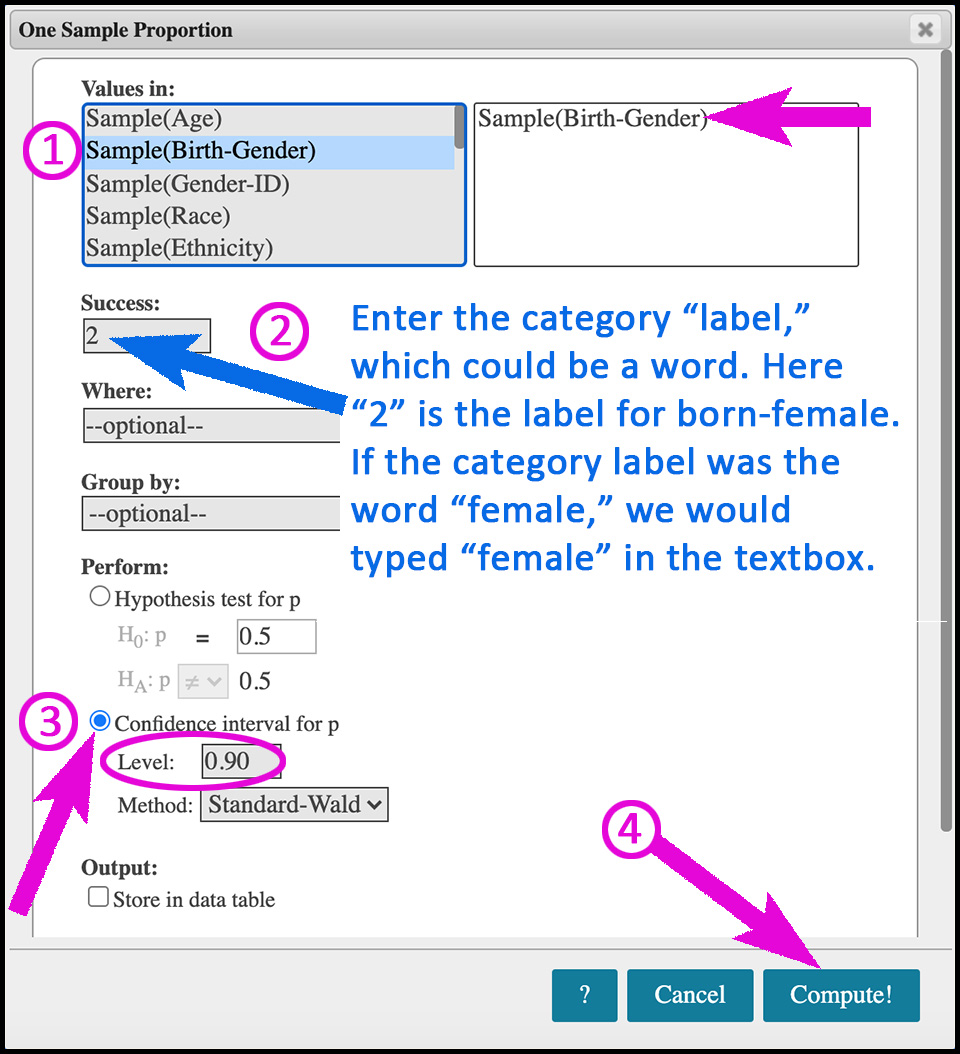
The One Sample Proportion window is now open.- Under the Values in: heading, click on the appropriate variable in the gray box on the left so that it appears in the white box on the right.
- Under the Success: heading, enter the label for the variable's category (group). For example if the category label is actually "female," you would type "female" in the textbox. However, in this particular data set, the label for the born-female group is the number 2, so we typed "2" rather than the word "female" in the textbox.
- Under the Perform: heading, check the Confidence interval for p radio dial. Then enter the confidence level as a decimal number in the Level textbox. In this example, we wanted a confidence level of 90%, so we entered 0.90 in the Level textbox.
- Click Compute!
Step 3
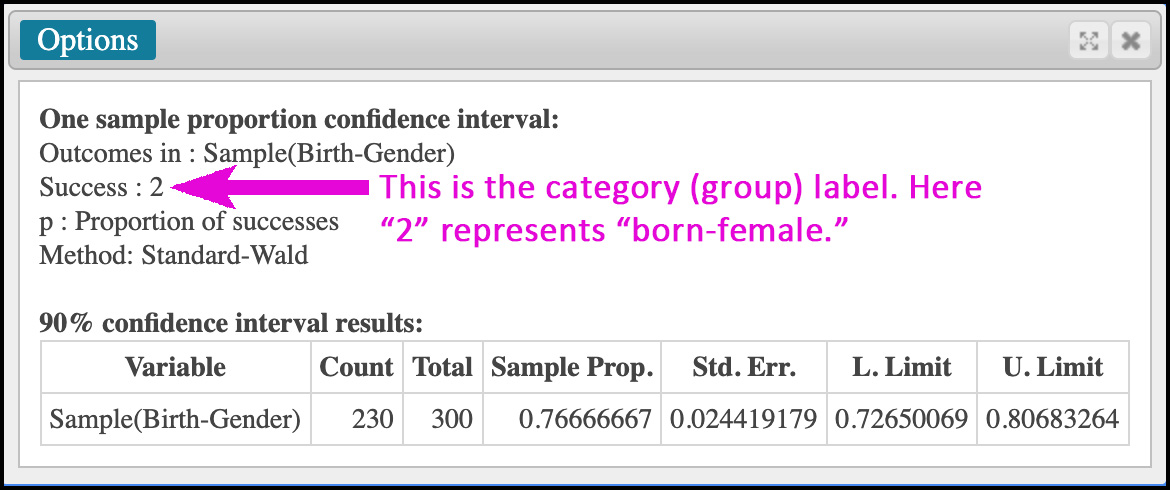 From this StatCrunch output table we have the following.
- �^≈0.7667
- The lower limit of our confidence interval is about 0.7265.
- The upper limit of our confidence interval is about 0.8068.
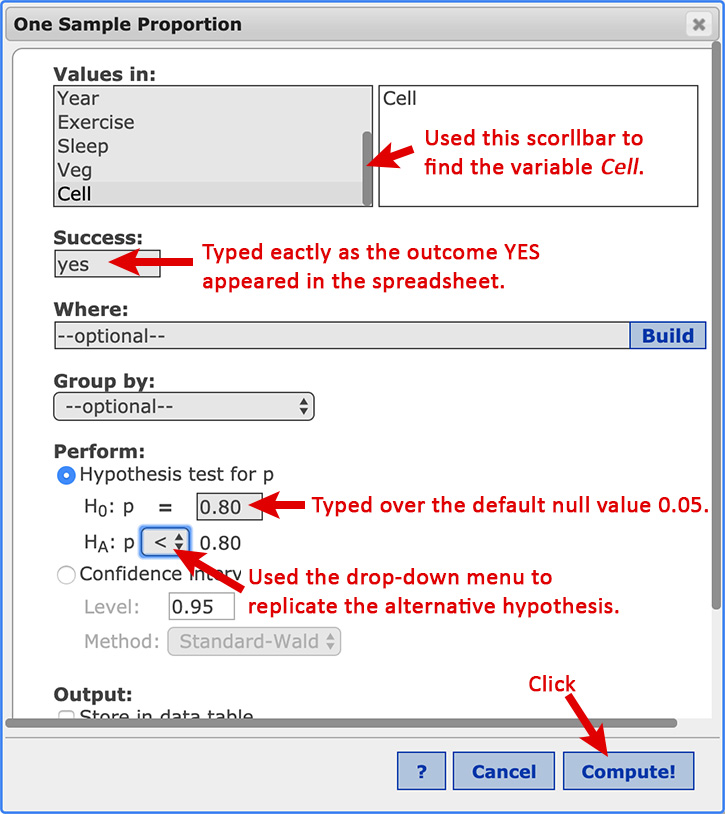
- Choose Stat ⟶ Proportion Stats ⟶ One Sample ⟶ With Data
- Under the Values in: heading, click on the categorical variable with the outcomes for the test. Note: you may need to use the scroll bar for the white box to find the appropriate variable.
- In the State: text-box specify the outcome that denotes a success. For example, if the outcomes are yes and no, and yes denotes a success, you would type yes in the text-box. WARNING: you must type the outcome exactly as it appears in the spreadsheet. For example if yes denotes a success and you type Yes with a capital Y, StatCrunch will not perform the test.
- Under the Perform: heading, check the radio button for Hypothesis test for p. Complete the null hypothesis by entering the null value (type over the default of 0.5). To complete the alternative hypothesis, use the drop-down menu to select <, >, or ≠.
- Click Compute!
One sample proportion confidence interval:
Outcomes in : Sample(Birth-Gender)
Success : 2
p : Proportion of successes
Method: Standard-Wald
90% confidence interval results:Variable Count Total Sample Prop. Std. Err. L. Limit U. Limit Sample(Birth-Gender) 708 1000 0.708 0.014378317 0.68434977 0.73165023