Context
Here is a boxplot for a distribution of data.
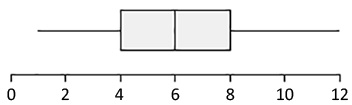
Calculate the IQR for the boxplot shown.
Make up a data set (n = 10) that has the same minimum value, same median, and same maximum value, but a larger IQR than the boxplot shown. List your data set and then describe your strategy.
Make up another data set (n = 10) that has the same minimum value, same median, and same maximum value, but a smaller IQR than the boxplot shown. List your data set and then describe your strategy.