Project 1 covers the creation of a simple data set, the availability of the Toolpak, descriptive statistics, and your interpretation of simple probability. You will need to create and build an Excel spreadsheet (.xls or .xlsx)
Before you begin, you can review this video.
To complete the project, download the Project 1 Instructions.
When you have completed the project, upload your final Excel sheet here.
Project 2: Descriptive Groundwork
Project 2 again covers the creation of a simple data set, the availability of the Toolpak, descriptive statistics, and your interpretation of simple probability. You will need to create and build an Excel spreadsheet (.xls or .xlsx). The purpose of this second project is to apply the work that you did in Project 1 and extended it in a manner that supports the most fundamental statistical transformation- conversion to z-scores.

For this project, you will need to collect the following data in exactly this manner:
Select a country.
Select 5 cities in the country
For each of the city, select the forecast high and low
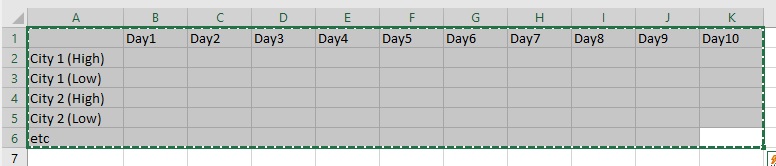
Build a table for these data.
It should look like this in row-major order:
Part I
For each of the cities highs and low temperatures, calculate the following using the toolpak:
Mean
Standard Deviation
Variance
Place these values in the columns next to the row of temperatures.
- Part II
- With the information you have created, recreate the city data temperature with z-score, again in row-major order. To help you do this, there is a walkthrough for z-score calculations that explains the process. Note, however, that the rows and columns are used differently between the walkthrough and this project.
- The new table should look as follows:

Part III
Using the toolpak, produce a histogram, and calculate the following for the z-score columns:
Mean
Standard Deviation
Variance
Place these values in the columns next to the row of temperatures.
Place the histograms on sheet1.
Remember to show all your work, keeping all sheets as part of your project and submit your project here.