Overview
Reply to 2 peers.
peer #1:
Men Women
Minimum - 3 Minimum - 2
Q1 - 18 Q1 - 15
Median - 35 Median - 27
Q3 - 73 Q3 - 35
Maximum - 85 Max - 54
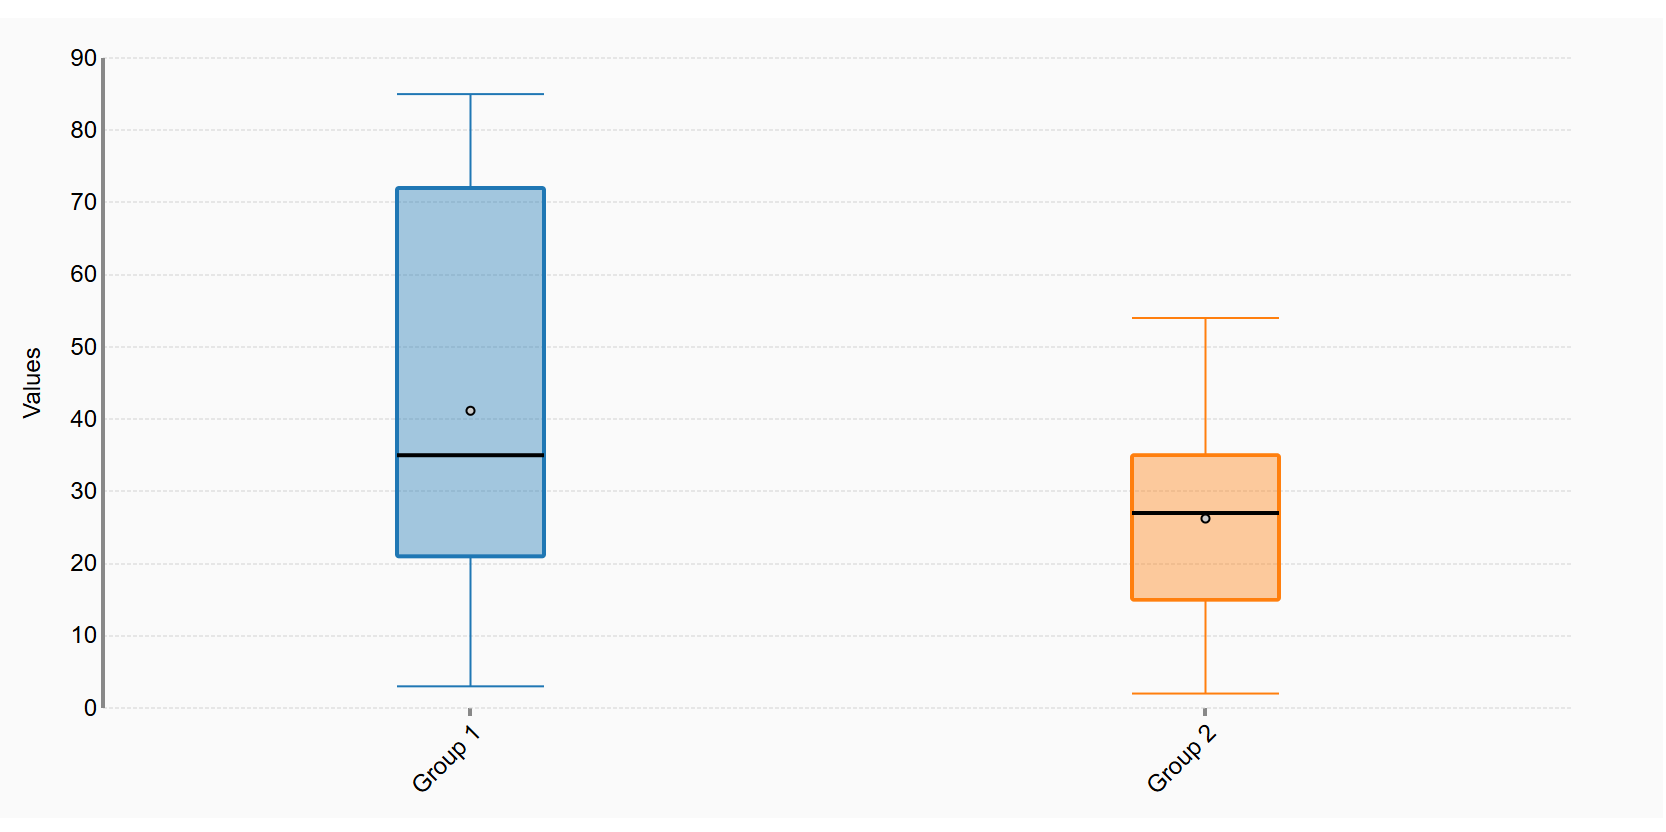
We can see in the picture that the men’s group has higher overall relief times and a much wider spread in their data. Their mean relief time is longer than the women’s mean, which means that on average, men took longer to feel initial relief from their migraine. The women’s group experienced faster and more consistent relief. Their median of minutes is lower than the men’s median, and their interquartile range is smaller, meaning most of their times are closer together. Overall, the women’s summary statistics show that they had a quicker and more predictable response to the medication.
Peer#2:
1. Fiver number summary: men- minimum=3, Q1=21, median=35, Q3=72, maximum=85 Women- minimum=2, Q1=15, median=27, Q3=35, maximum=54
men sample standard deviation: 27 women sample standard deviation= 26
2. The summary statistics for the group of men is more spread out, and the values for the group of women are also less. The men's group also have greater values when it comes to the minimum and maximum.
3. 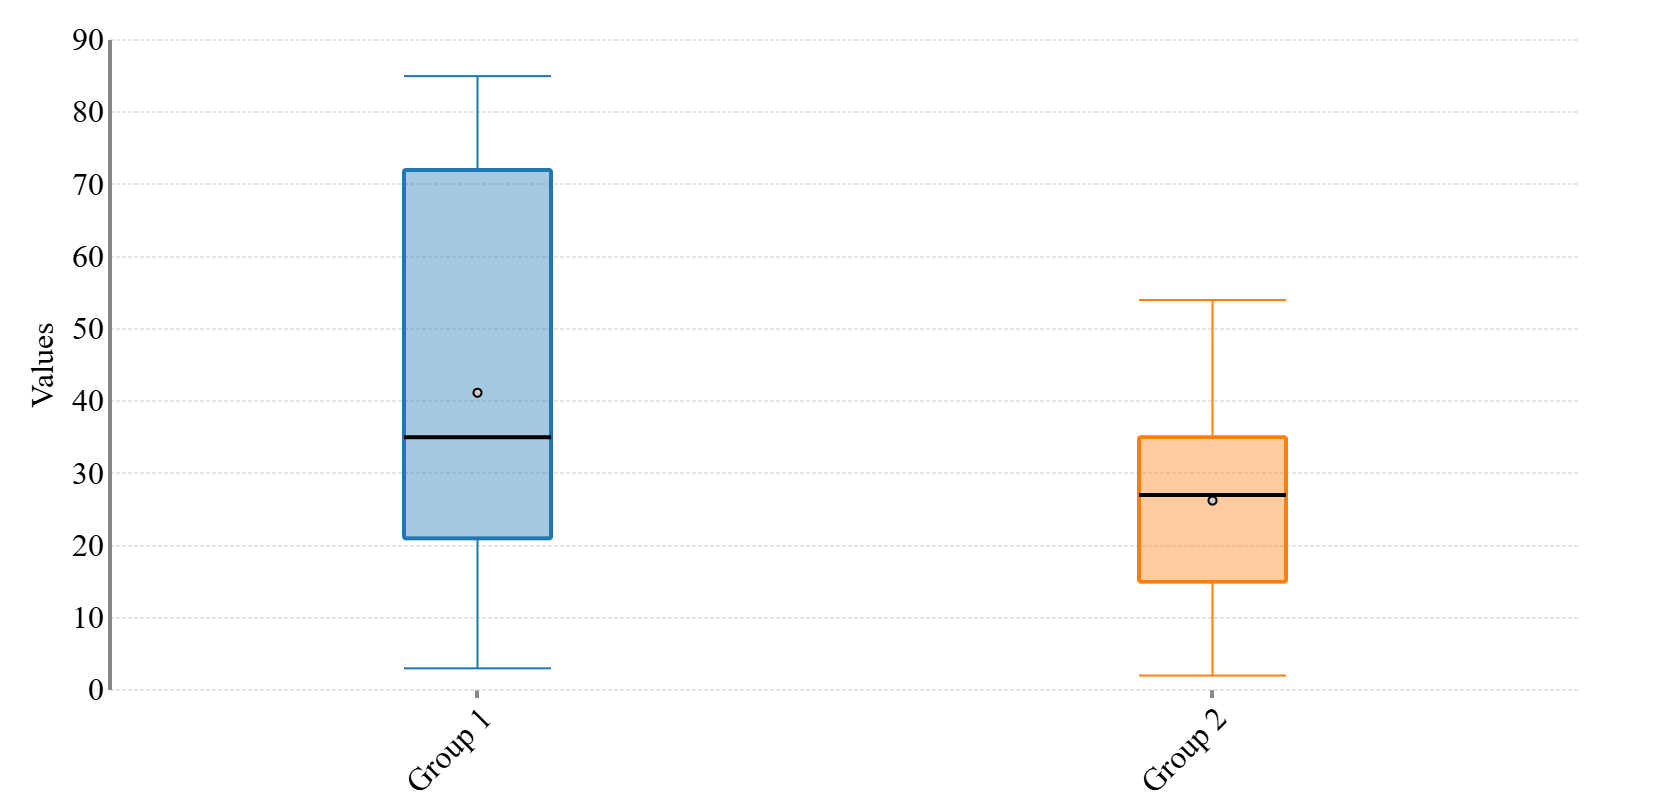
From the visual, we can say that group 1(men) has higher values, and it is more spread out. It also has a little bit of a skew not much. Group 2 (women) is less spread out then group 1, and group 2 is visibly more symmetrical as well.