Progress Check
Use this activity to assess whether you and your peers can:
- Under appropriate conditions, conduct a hypothesis test about a mean for a matched pairs design. State a conclusion in context.
Directions
Use the drop-down menu to learn about the three steps needed to complete this assignment.
Three steps to complete the assignmentStep 1: Review the Rubric
- Before you submit your work, review the rubric at the bottom of this assignment.
- Use the rubric as a checklist to determine whether you are ready to submit your work.
Step 2: First Draft
- Commit a good-faith effort to address each item in the Prompt section below.
- Please be sure to number your responses and include "white space" between problem numbers. This improves the readability and flow of your work. I cannot give feedback and grade jumbled work.
- Use either of the following options to submit your work.
OPTION 1: You can submit a text-entry assignment (i.e. typing your answers in Canvas). To learn how to submit a text-entry assignment, use these directions (opens in a new tab).
OPTION 2: You can upload your paper-and-pencil work (or the digital equivalent). To learn how to upload your paper-and-pencil work, use these directions (opens in a new tab). WARNING - some file types may not be visible on my end. So to learn which files you can upload, be sure to use the directions link I provided for this option. - Not ready to submit a good-faith effort yet? Avoid frustration - use the link to the Questions, Answers, & Tips discussion board (at the bottom of this page) to post questions about this assignment (or visit the discussion board to answer your classmates' questions). You can also contact me directly (see the homepage for my contact information).
Step 3: Optional Final Draft
- After you submit your good-faith attempt to fully respond to the questions in the Prompt section below, advance to the ANSWER(S) page.
- You can use the ANSWER(S) page to correct your work and resubmit this assignment any time before I begin grading the problems. However, to earn full credit, you are not required to submit a final draft for this assignment. But if you do submit a final draft, I will only grade it if you submitted a good-faith effort on your first draft.
- Warning - I will only grade your most recent submission. So if you choose to submit a final draft, please do not leave anything out, and please do not direct me to read an earlier submission. To maximize your score, your most recent submission (at the time I begin grading) must be complete.
Context
Gosset's Seed Plot Data
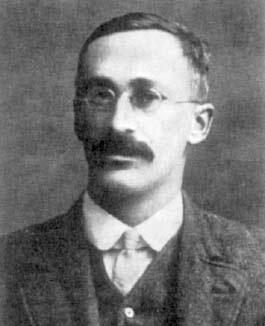
William S. Gosset was employed by the Guinness brewing company of Dublin. Sample sizes available for experimentation in brewing were necessarily small. At that time, Gosset contacted a famous statistician Karl Pearson (1857-1936) and was told that there were no techniques for developing probability models for small data sets. Gosset studied under Pearson, and the outcome of his study was perhaps the most famous paper in statistical literature, "The Probable Error of a Mean" (1908), which introduced the T-distribution.
Since Gosset was employed by Guinness, any work he produced would be owned by Guinness, so he published under a pseudonym, "Student"; hence, the T-distribution is often referred to as Student's T-distribution.
To illustrate his analysis, Gosset used the results of seeding 11 different plots of land with two different types of seed: regular and kiln-dried. He wanted to determine if drying seeds before planting increased plant yield. Since different plots of soil may be naturally more fertile, this confounding variable was eliminated by using the matched pairs design and planting both types of seed in all 11 plots.
The resulting data (corn yield in pounds per acre) are as follows.
| Plot | Regular seed | Kiln-dried Seed |
|---|---|---|
| 1 | 1903 | 2009 |
| 2 | 1935 | 1915 |
| 3 | 1910 | 2011 |
| 4 | 2496 | 2463 |
| 5 | 2108 | 2180 |
| 6 | 1961 | 1925 |
| 7 | 2060 | 2122 |
| 8 | 1444 | 1482 |
| 9 | 1612 | 1542 |
| 10 | 1316 | 1443 |
| 11 | 1511 | 1535 |
We use these data to test the hypothesis that kiln-dried seed yields more corn than regular seed.
Because of the nature of the experimental design (matched pairs), we are testing the difference in yield.
| Plot | Regular seed | Kiln-dried Seed | Difference |
|---|---|---|---|
| 1 | 1903 | 2009 | –106 |
| 2 | 1935 | 1915 | 20 |
| 3 | 1910 | 2011 | –101 |
| 4 | 2496 | 2463 | 33 |
| 5 | 2108 | 2180 | –72 |
| 6 | 1961 | 1925 | 36 |
| 7 | 2060 | 2122 | –62 |
| 8 | 1444 | 1482 | –38 |
| 9 | 1612 | 1542 | 70 |
| 10 | 1316 | 1443 | –127 |
| 11 | 1511 | 1535 | –24 |
Note that the differences were calculated: regular − kiln-dried.
Variables
Regular seed: regular seeds that were traditionally used for planting Kiln-dried seed: seeds that were kiln-dried before planting
Data
Open the seeds datafile in the Stats at Cuyamaca College group on StatCrunch (directions - opens in a new tab).
Prompt
- State the hypotheses and define the parameter.
- Checking conditions: Since Gosset invented the T-distribution, we will assume that his sample meets the conditions and proceed with the T-test. Regardless, answer these questions to demonstrate your understanding of the conditions for use of the T-model.
But first you will need to review the dotplots for the data (opens in a new tab).- Which graph is used to check conditions? Why?
- What do we look for in the graph to verify that conditions are met?
- What else do we need to know about the sample of seeds before using the T-test?
- Use StatCrunch to find the T-score and the P-value. Hint: as you work through the StatCrunch directions, keep in mind that we want to calculate the differences as regular − kiln-dried . So you will choose Regular seed for Sample 1 and Kiln-dried seed for Sample 2. (directions)
Copy the information in the StatCrunch output window and paste it into the textbook with your response. - State a conclusion based on the context of this scenario.
List of StatCrunch Directions
Click here for StatCrunch DirectionsEach link will open in a new window. To return to this assignment, either close the new tab or select the tab for this assignment.- Purchase StatCrunch (You only need to do this once.)
- Open StatCrunch
- Download StatCrunch Output Window (no screenshots; please use these directions)
- Conduct Matched-Pairs T-test
- Copy & Paste a StatCrunch Table
Here is a PDF document with all StatCrunch directionsLinks to an external site..
Module 22 Discussion Board
Use the Module 22 discussion board (opens in a new tab) to ask questions or provide feedback about the problems in any Module 22 activity - including this peer-reviewed assignment.
Review Feedback
- Instructor feedback is only available after an assignment is graded.
- Use these directions (opens in a new tab) to learn how to review feedback.
Click the "Next" or > button to continue.
Content by Cuyamaca College math faculty and licensed under the Creative Commons 4.0 International LicenseLinks to an external site..
Rubric
Formative Assessments w/ StatCrunch
| Criteria | Ratings | Pts |
|---|---|---|
This criterion is linked to a Learning OutcomeAnswering the Prompt | 8 ptsFull CreditThe first submission demonstrates a good-faith effort to address each part of the Prompt. Either in the first draft or the optional final draft, all parts of the "Prompt" are addressed and the responses demonstrate attainment of the learning objectives in the "Progress Check" section of the assignment. The answers are correct. The writing/work is clear. The explanation/work is reasonable, well-organized, and easy to follow.6.5 ptsMostly CorrectThe first submission demonstrates a good-faith effort to address most of the Prompt. In the optional final draft all parts of the "Prompt" are addressed, and the responses demonstrate attainment of the learning objectives in the "Progress Check" section of the assignment. The answers are mostly correct. The writing/work is clear. The explanation/work is reasonable, well-organized, and easy to follow. 3.5 ptsOne or more incorrectThe first submission demonstrates a good-faith effort to respond to a smaller portion of the Prompt. In the first draft or the optional final draft, one or more parts of the "Prompt" are not addressed or are incorrect. Or, answers do not demonstrate attainment of the learning objectives in the "Progress Check" section of the assignment. Or, answers are correct, but the writing/work is unclear, incorrect, or difficult to follow.0 ptsNo MarksThe first submission does not demonstrate a good-faith effort to address the Prompt. | 8 pts |
This criterion is linked to a Learning OutcomeStatCrunch | 2 ptsFull CreditStatCrunch graphs and/or tables are correct and embedded with your work.1 ptsPartial CreditStatCrunch graphs and/or tables are incorrect or missing important information. 0 ptsNo CreditNo StatCrunch information is embedded with your post. Or all StatCrunch work is incorrect. | 2 pts |
Total Points: 10